Open federal and cantonal geodata⏱Report link usually within 24 hours💳TWINT, card, Apple Pay, Google Pay↩Correction, otherwise refund (14 days)
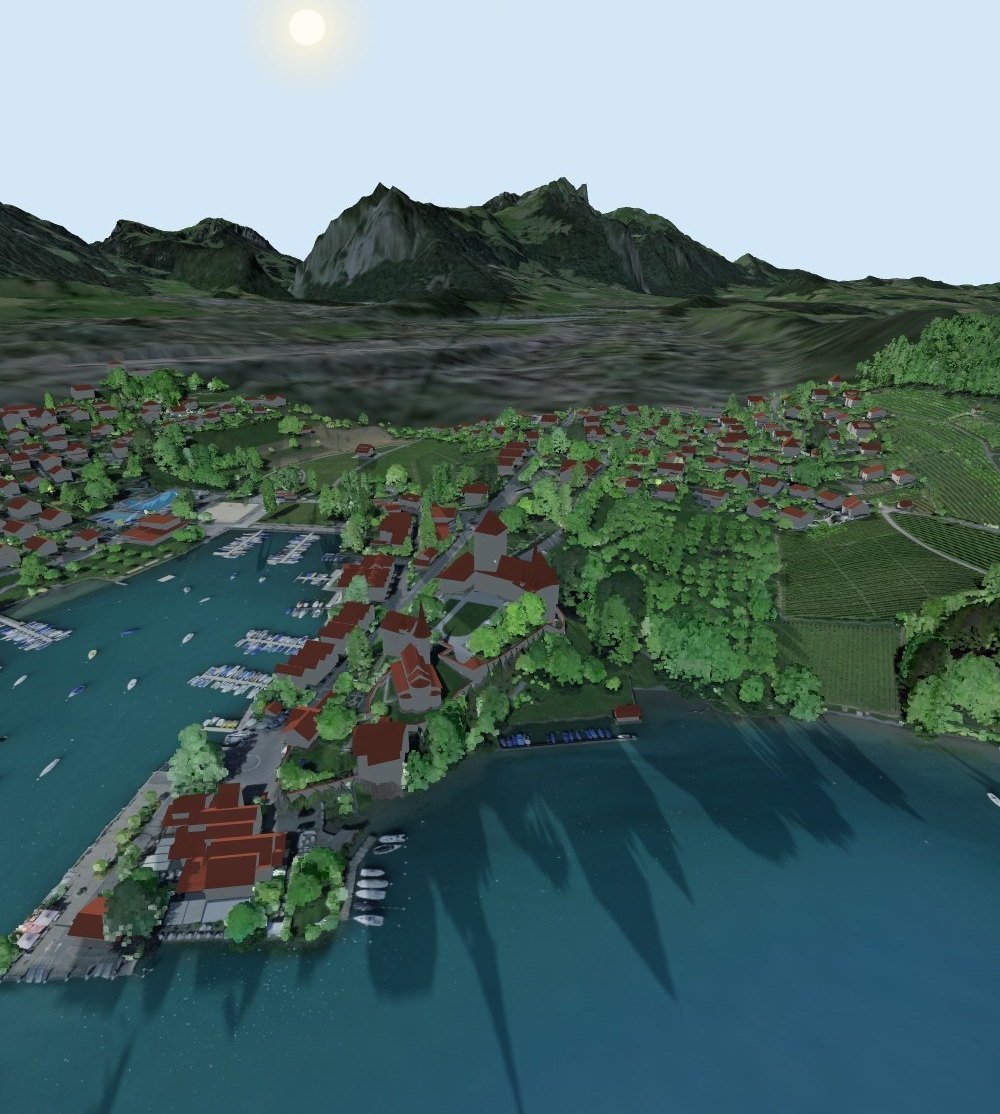
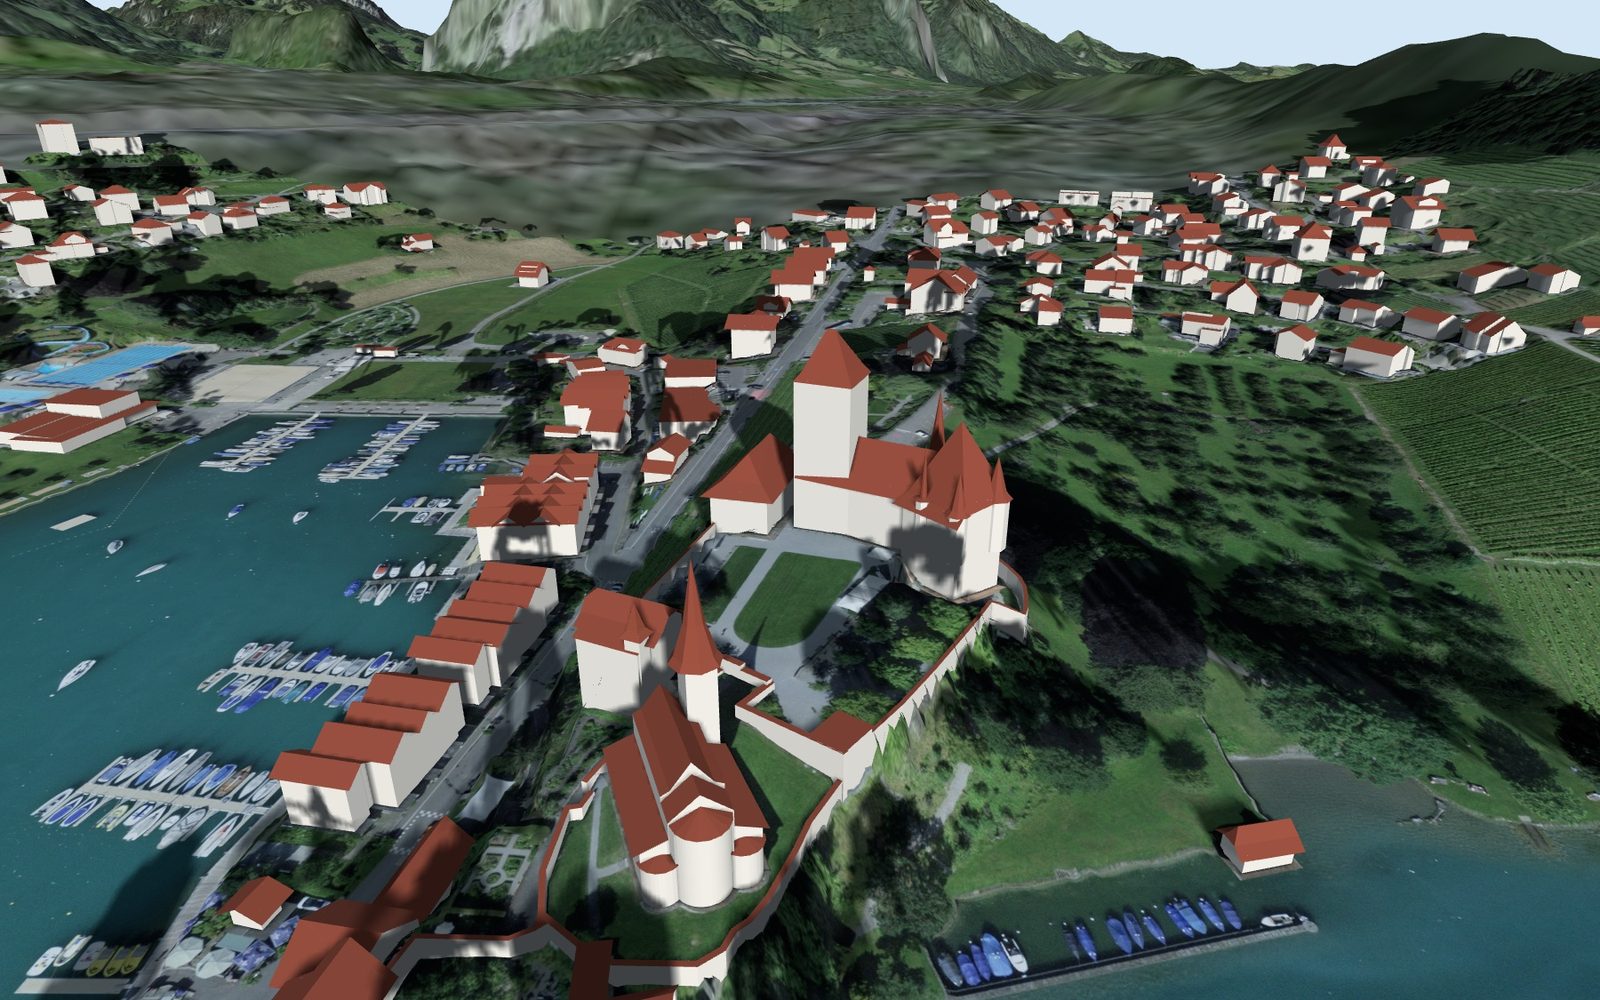
Spiez in the 3D model of the SunPlot report: harbour, castle, vineyards, Lake Thun and mountains in the evening sun
Interactive 3D report · every Swiss address

How much sun does your new home get?

Hours of sunshine, shadow at every hour, noise, public transport and natural hazards for one address. An interactive 3D report from official data, before you buy or rent.

Your personal 3D report shows sun, shadow and location at the address of your choice.

CHF 49 one-off · No subscription · Usually within 24 hours

  • Check: which official data is available at the address
  • Report CHF 49, link usually within 24 hours
  • We fix it or you get your money back; report it within 14 days
From the report: Spiez, 21 September, 17:48 · 3D data swisstopo, trees from the laser point cloud
Hours of sunshine

One day lies. The year doesn’t.

Sunny at the viewing, in the shade in winter? The report calculates every day of the year, with mountains, neighbouring buildings and trees.

7.3hSun on 21 December
15.2hSun on 21 June
34.7dBRoad noise at night, limit 50

Calculated values from the sample report Lidostrasse 5, Lucerne.

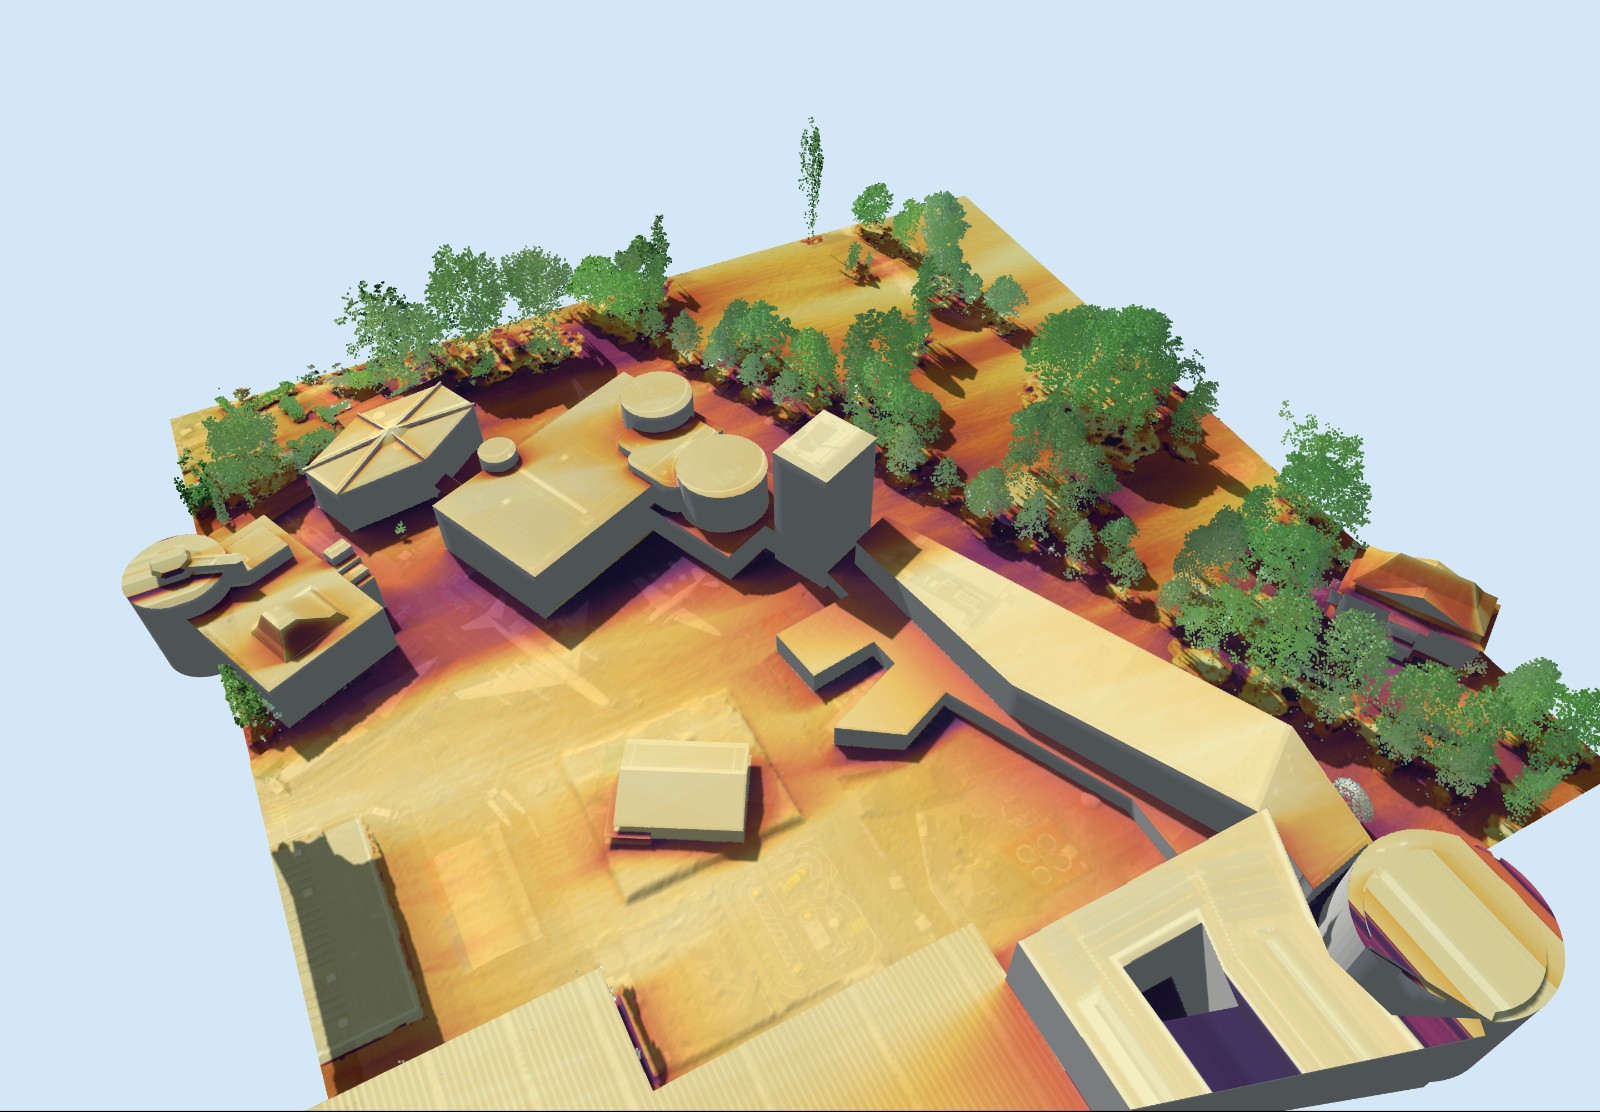
The hours of sunshine apply to a measuring point on the roof: at the ridge, or in the centre for flat roofs, 1.5 m above it. The 3D views around the house show how shadow falls on the garden, balcony and surroundings.

All chapters of the report →
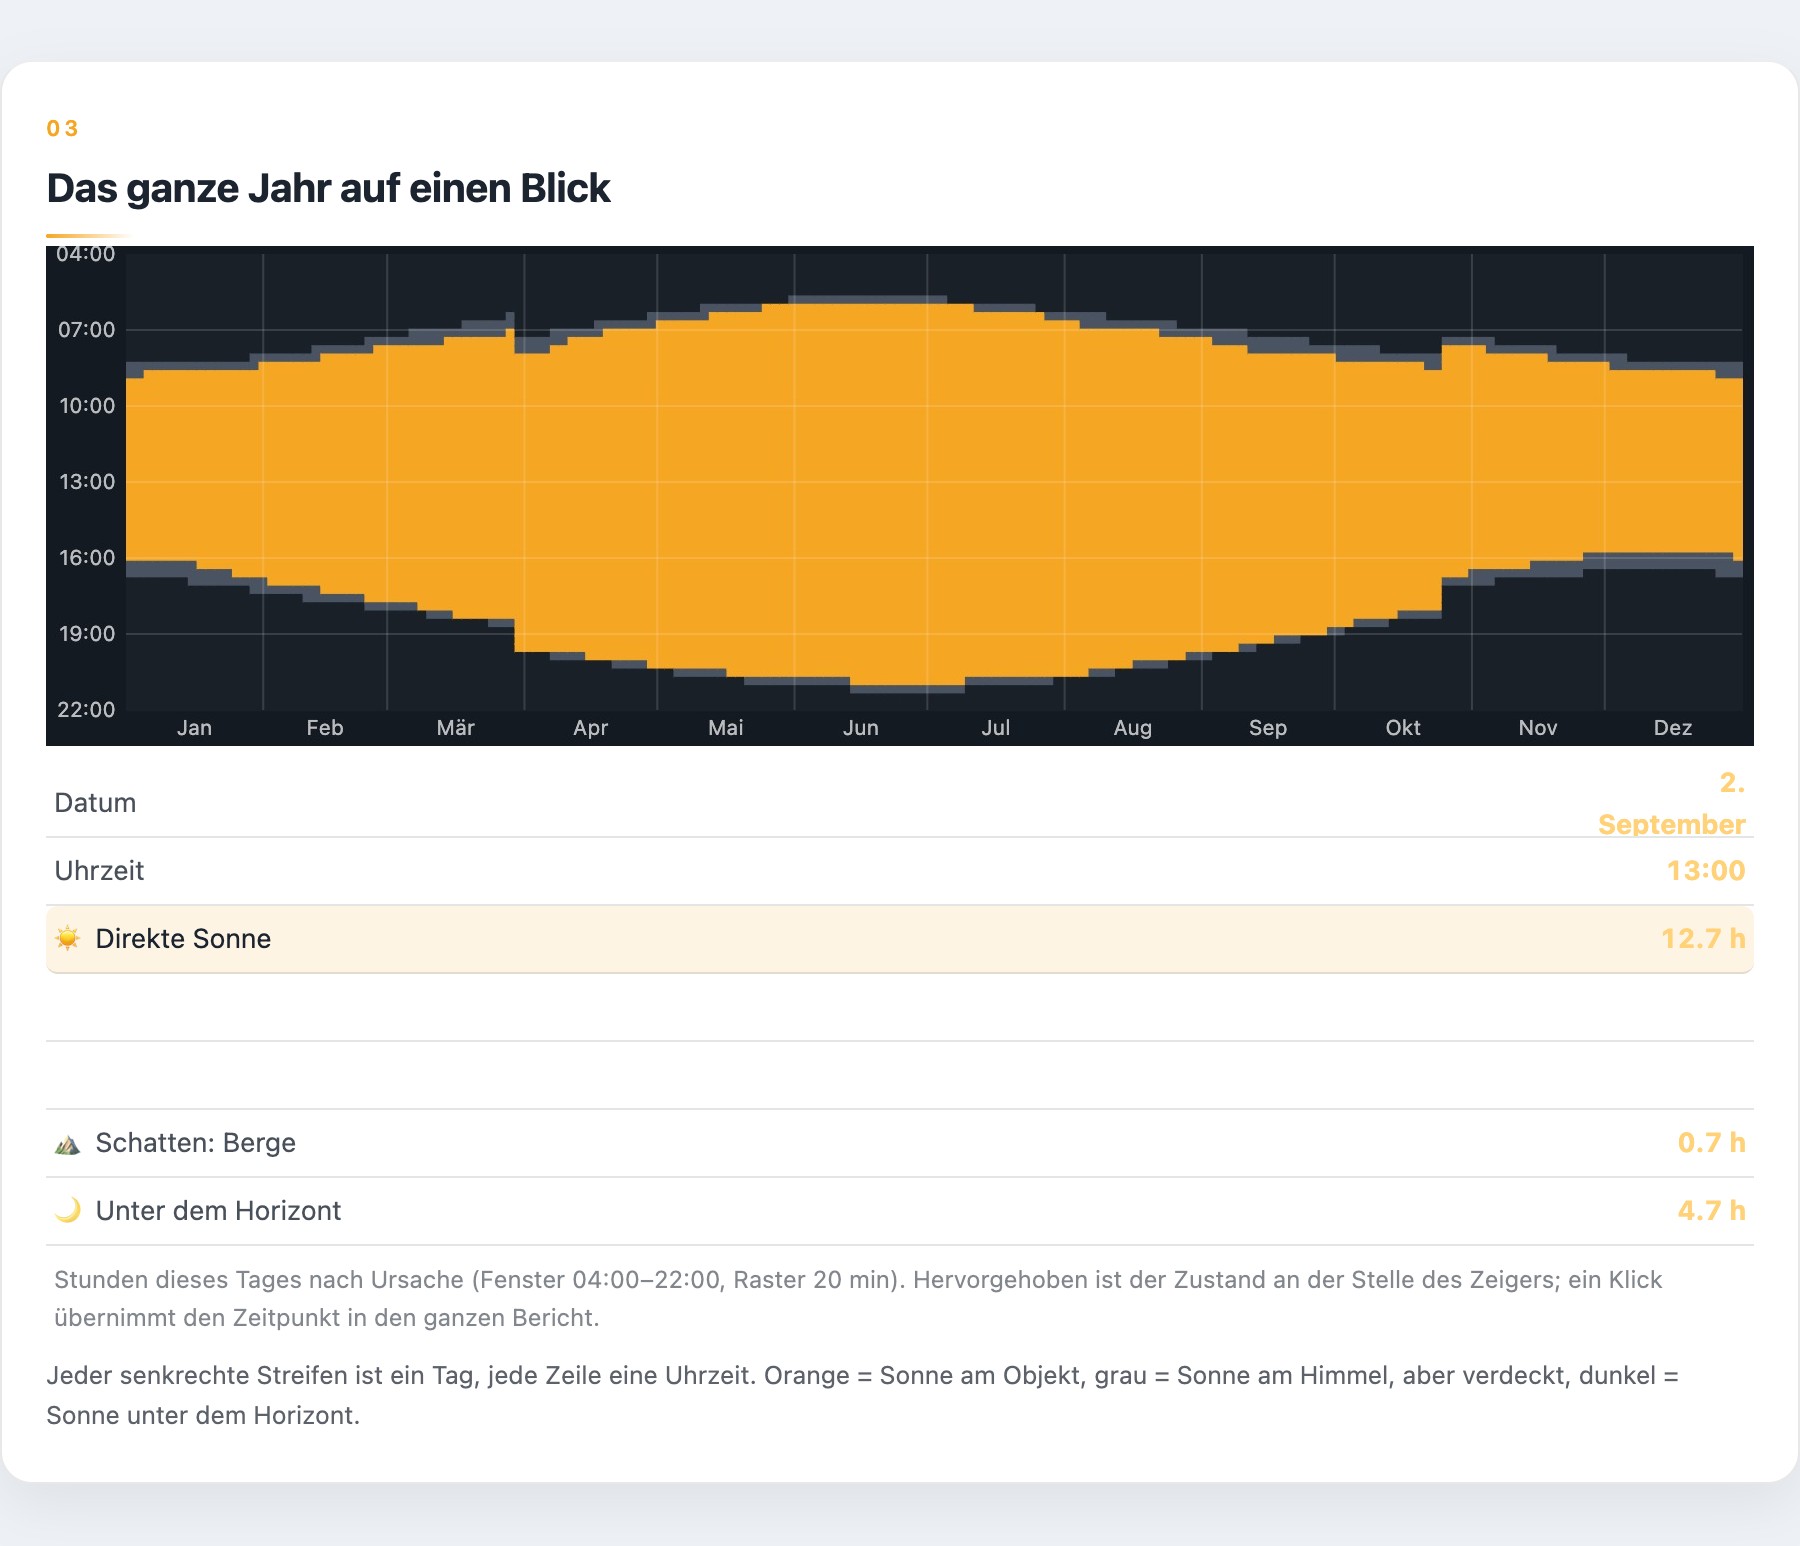
Hours of sunshine over the year from the report
From the report: hours of sunshine per day over the whole year, with sunrise and sunset at the location.
Shadow at every hour

Drag the slider through the day.

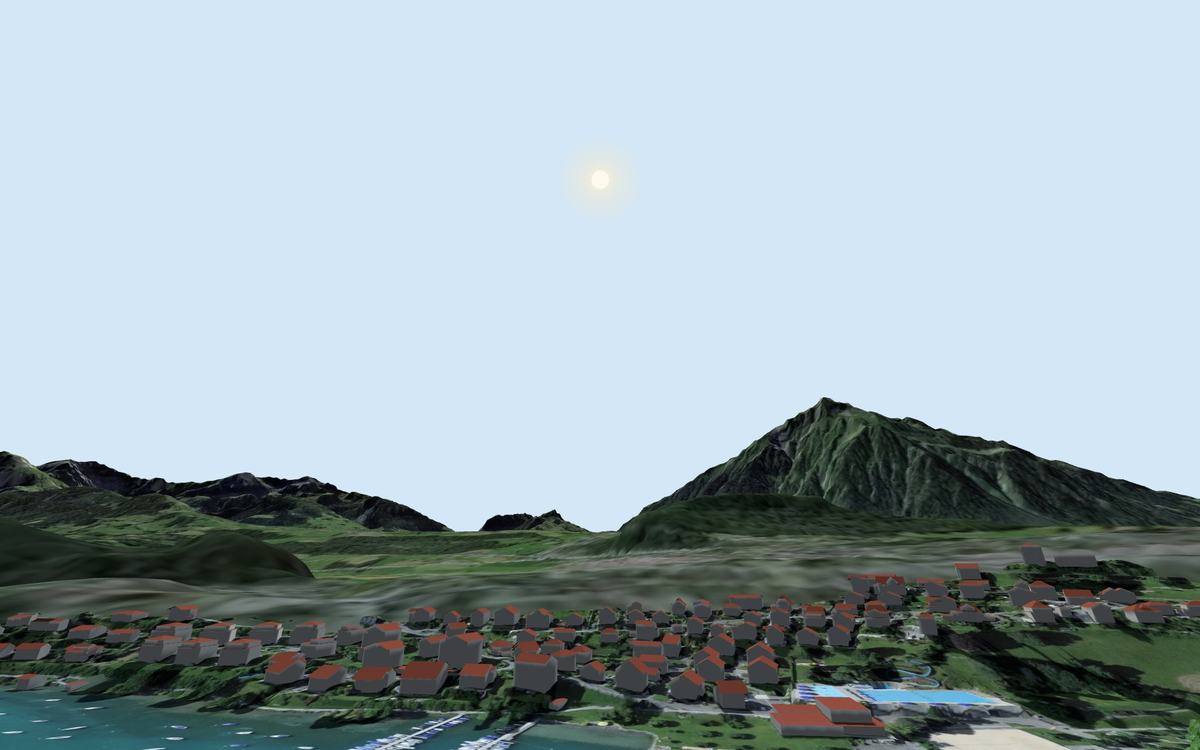
View from the house towards the sun: you see when it rises in the morning, when it disappears behind a mountain or neighbouring building and how long the balcony or garden gets sun. In the report for any date at your address.

More examples →
📅 21 September🌅 Sunrise 07:13🌇 Sunset 19:31
Sun path at Spiez Castle on 21 September: view from the location towards the sun
13:32
Spiez Castle, 21 September. From the 3D model with trees from the laser point cloud.
The location

The official maps. Right at the house.

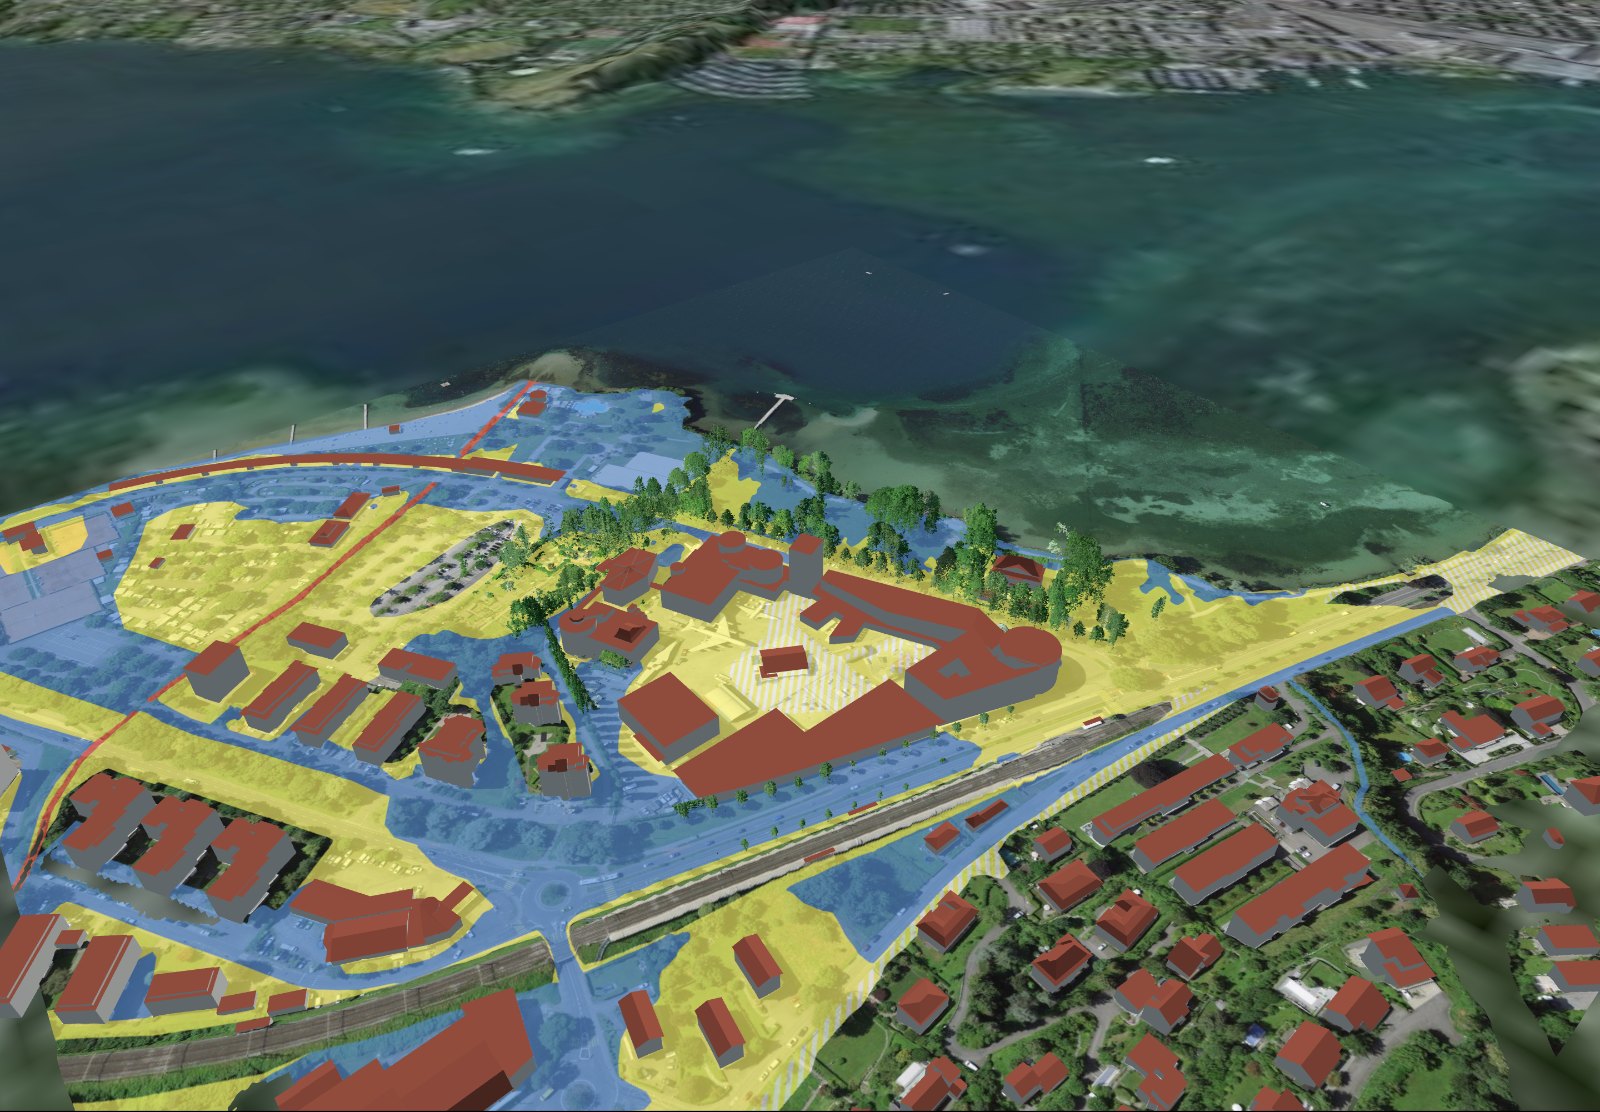
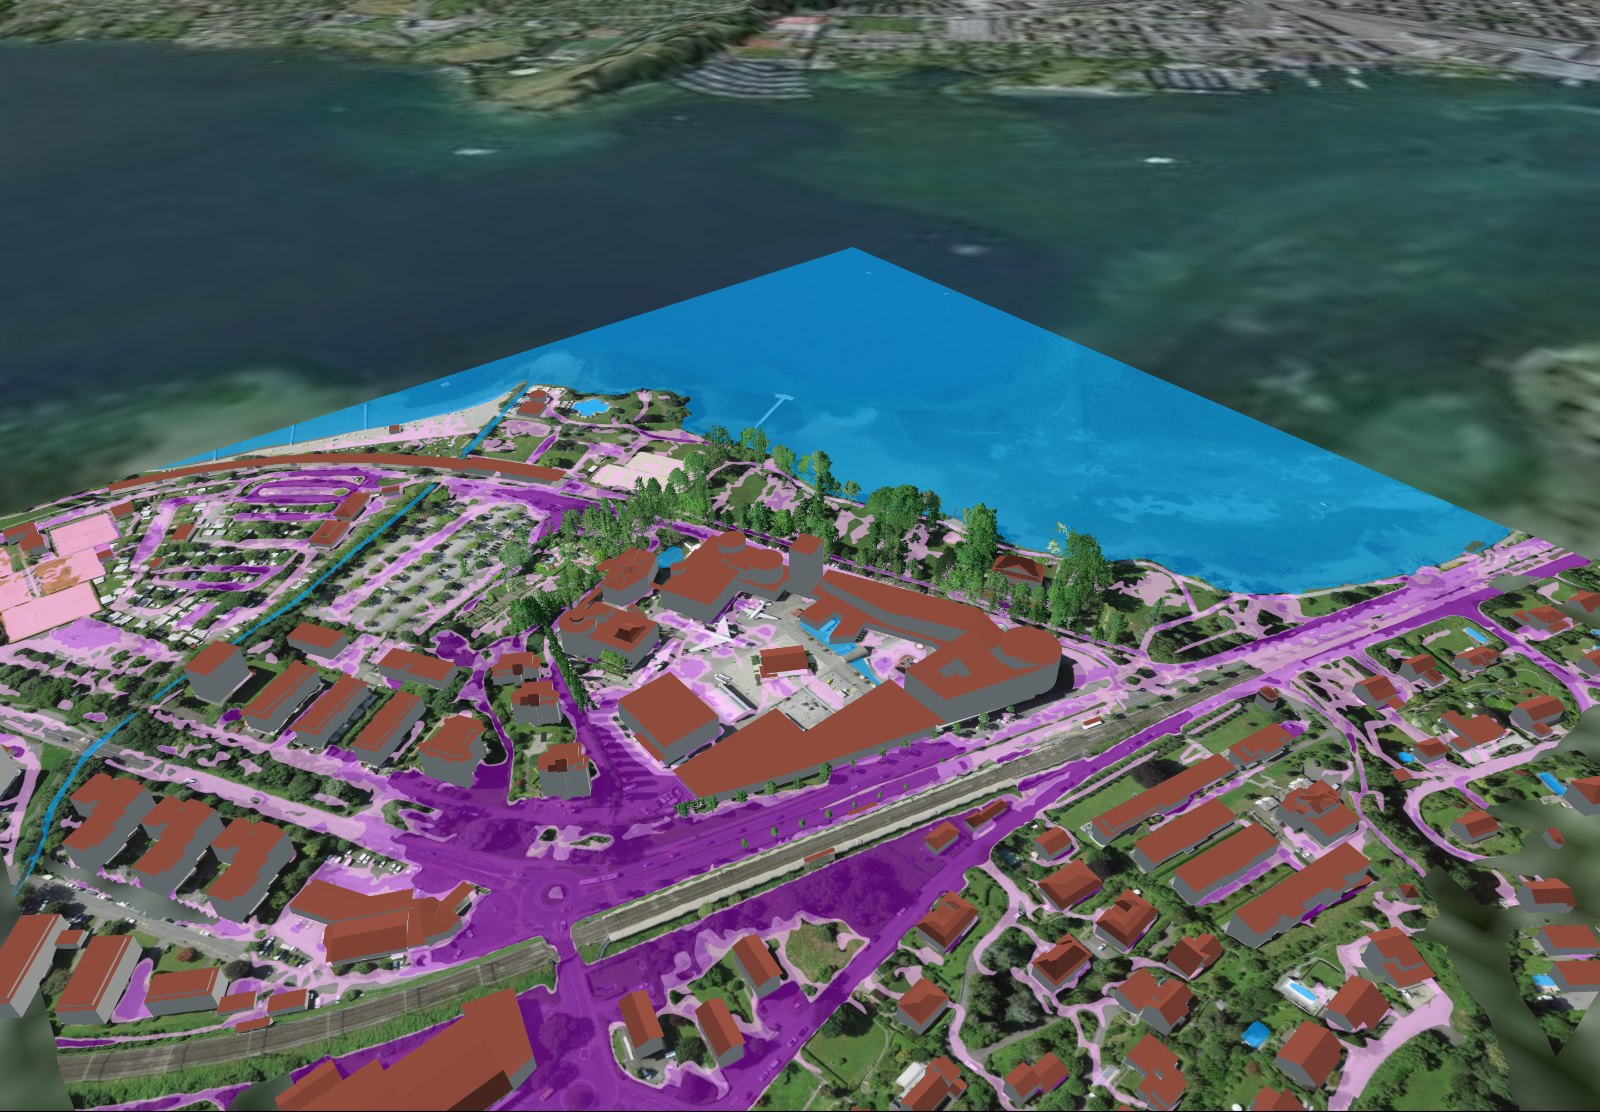
Noise, public transport, natural hazards, solar, surroundings, accidents, surface runoff and shadow hours. Not somewhere in the geoportal, but on the 3D model of your address.

Data and method →
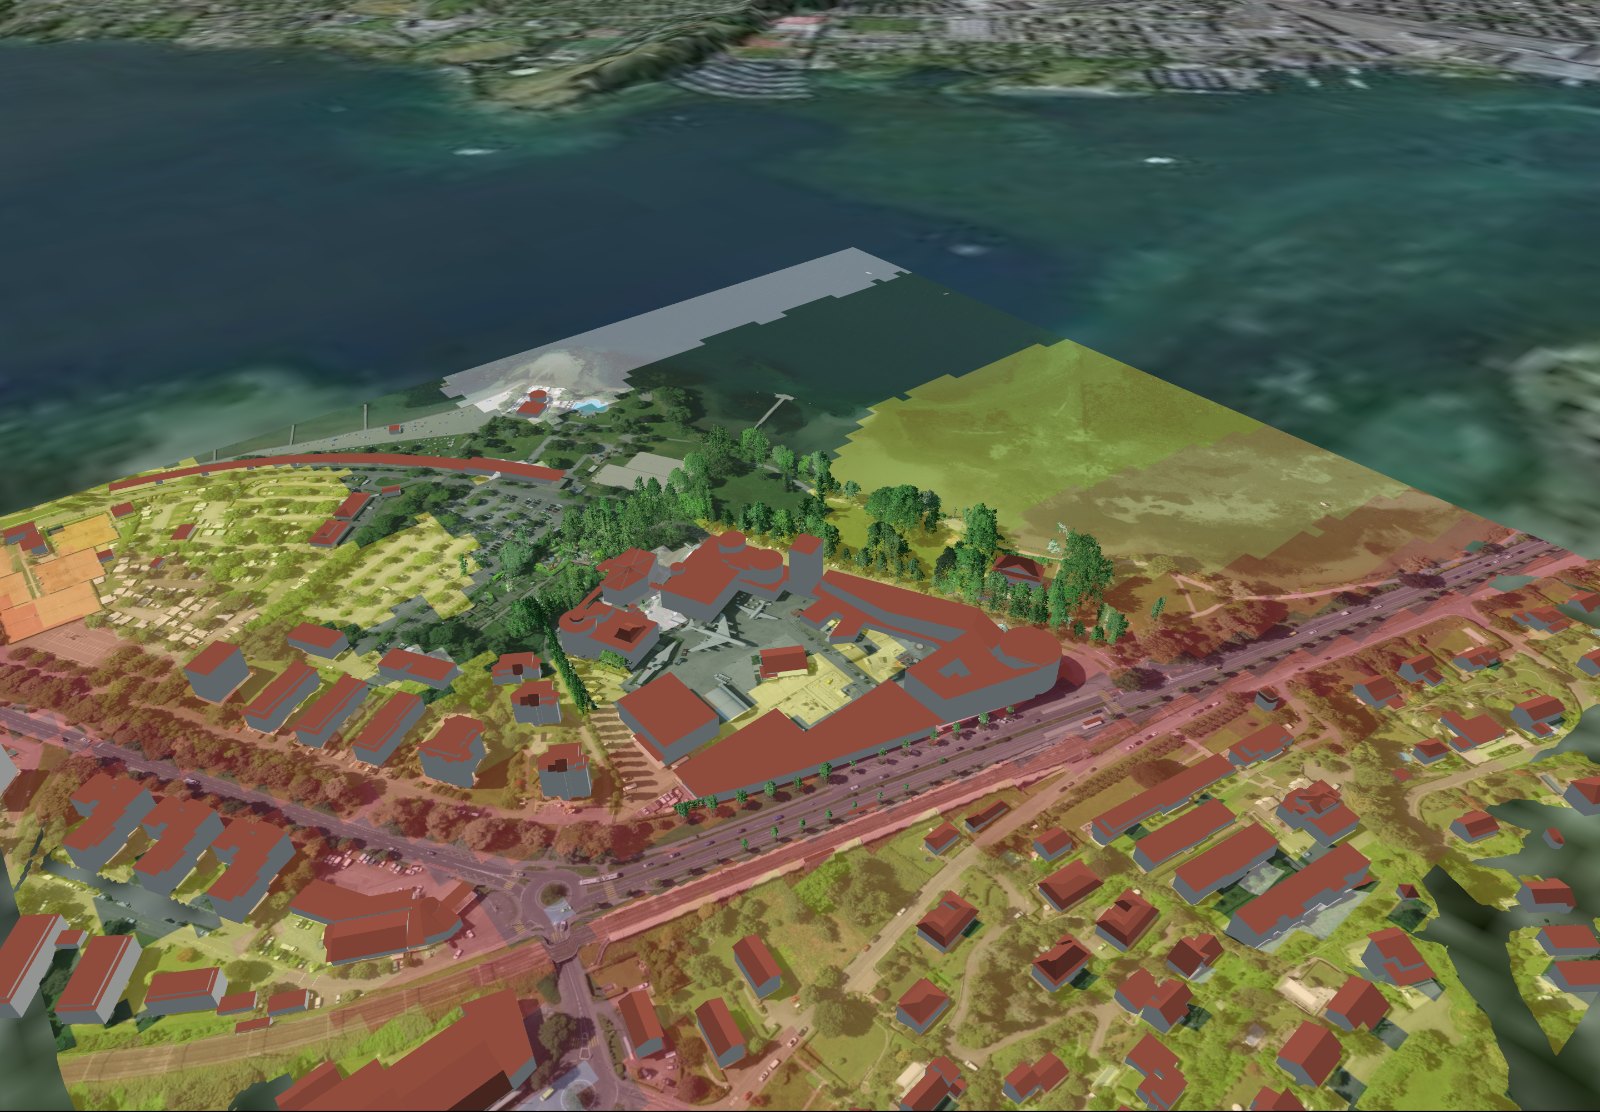
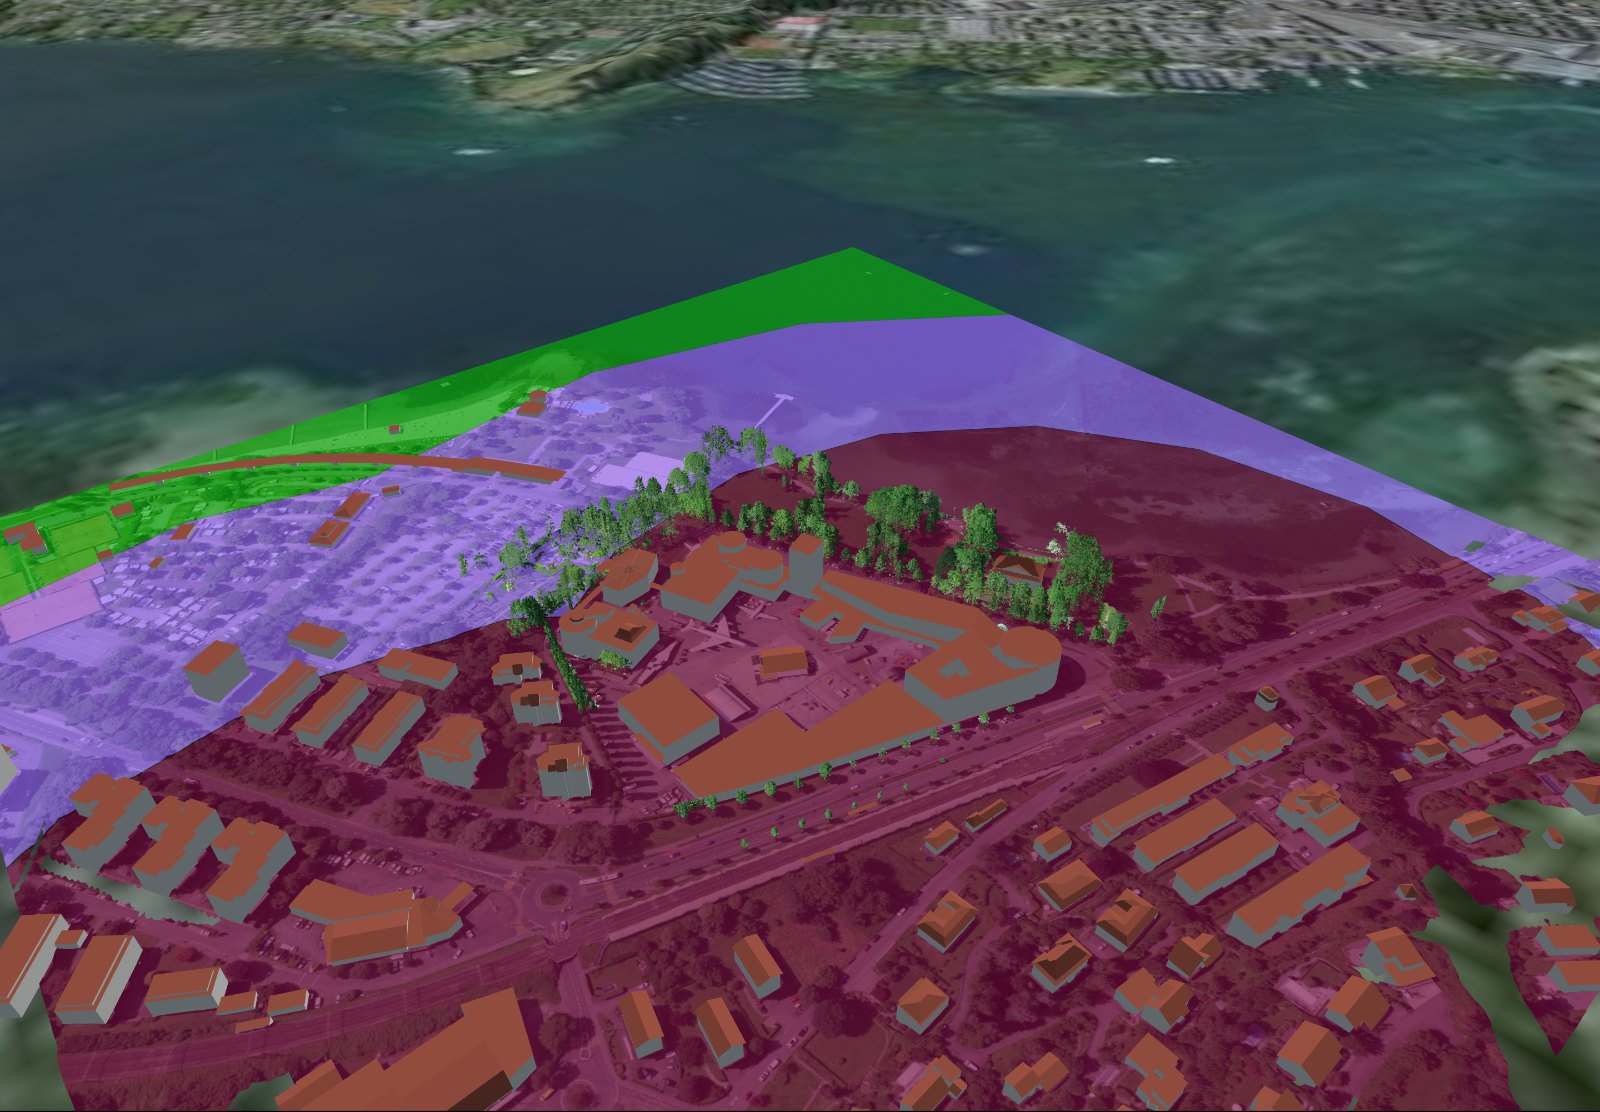
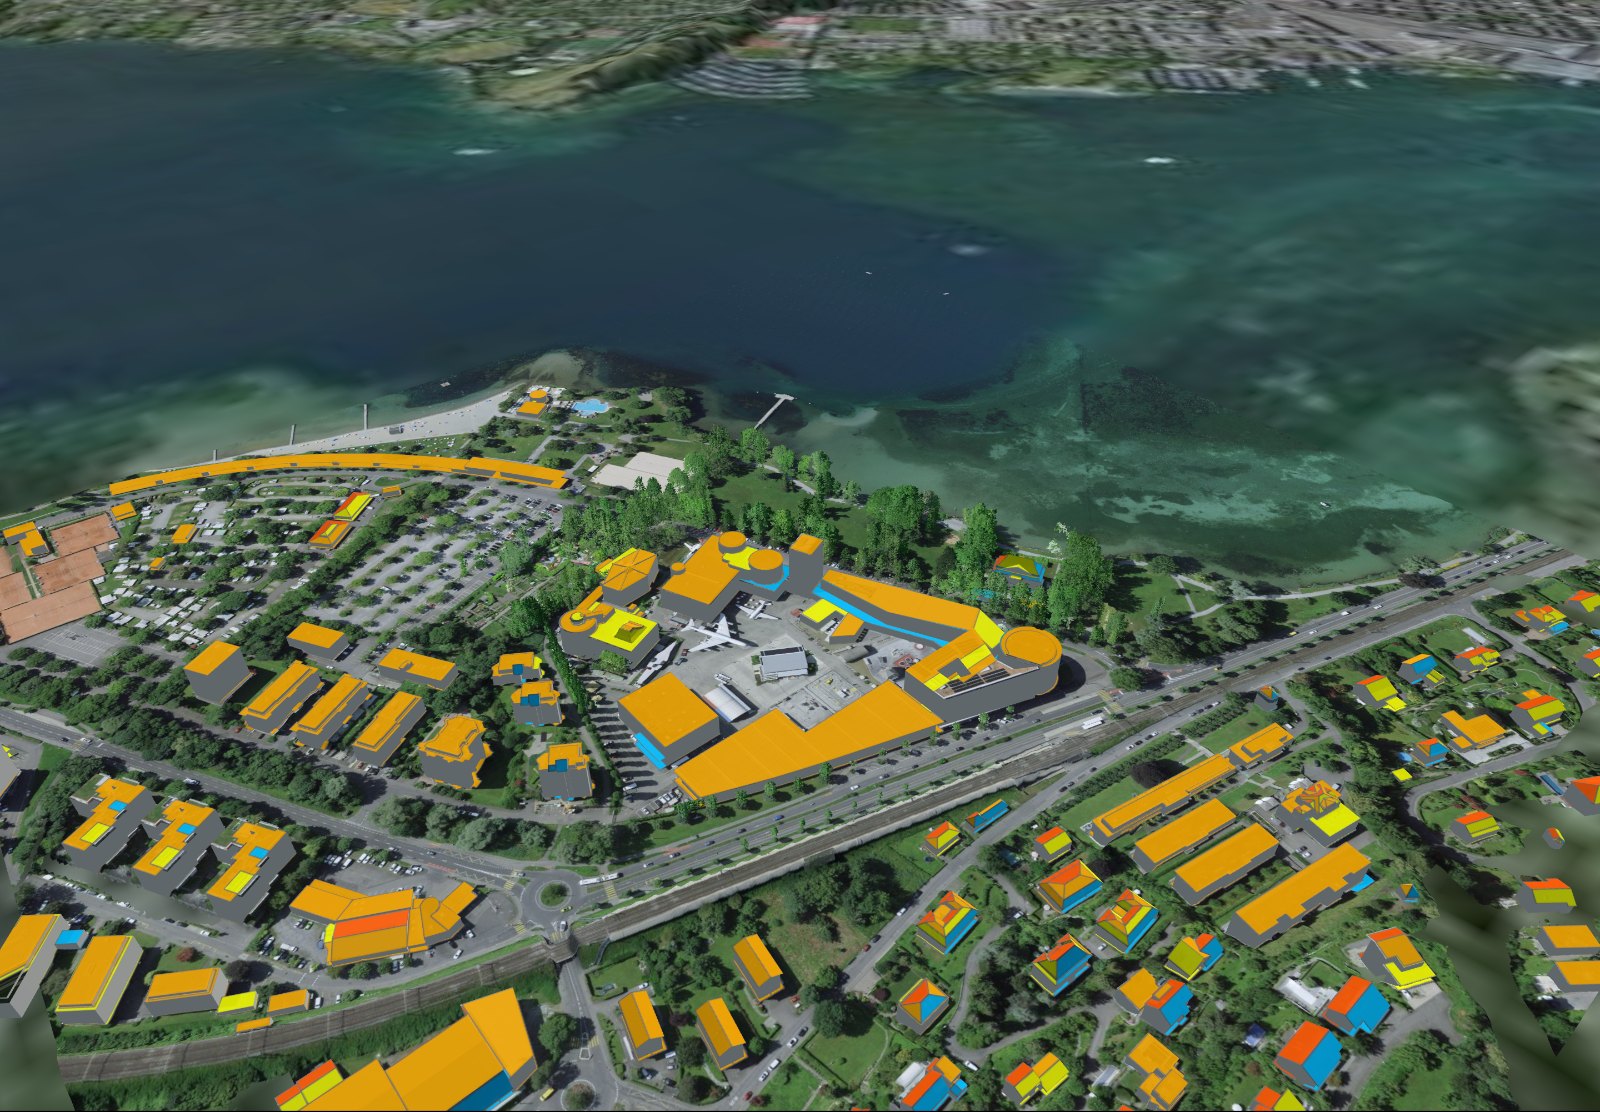
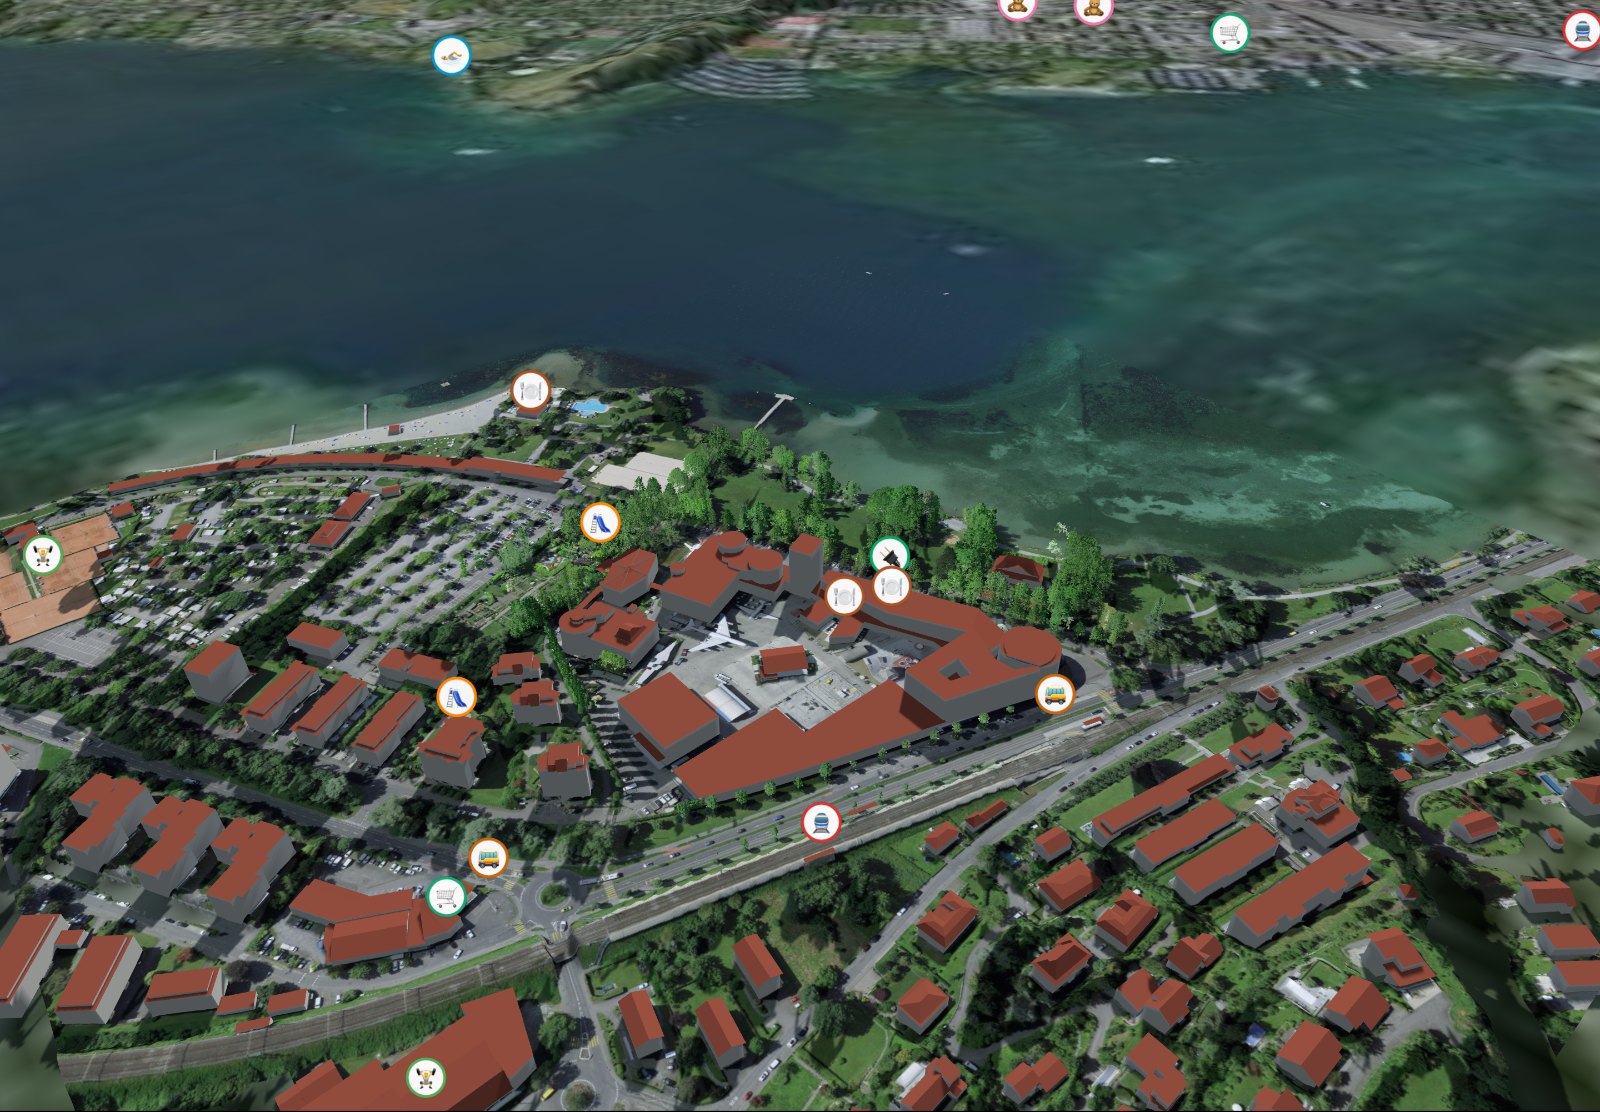
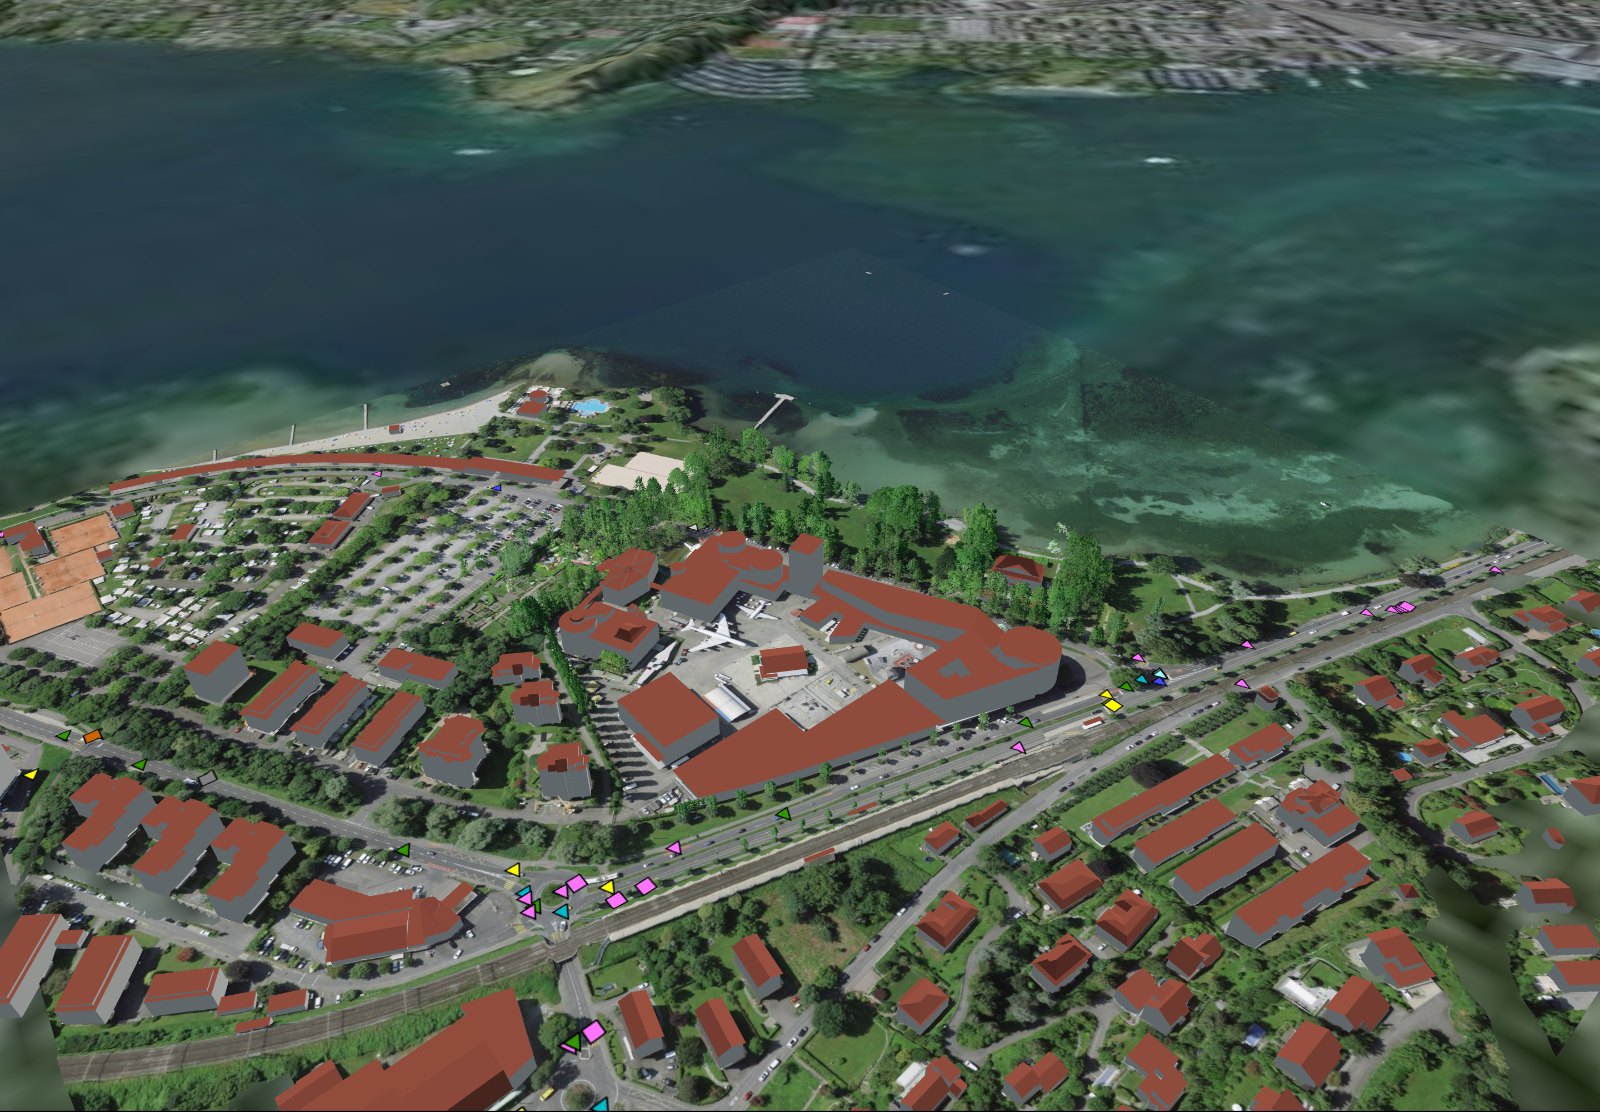
Noise map on the 3D model Public transport quality classes Natural hazards Solar potential Surroundings Road accidents Surface runoff Shadow hours

Road and railway noise, day and night, compared with the limit value.

Maps shown for the Swiss Museum of Transport in Lucerne. Sources: noise FOEN · public transport quality classes ARE · hazard map Canton of Lucerne (geodienste.ch) · solar SFOE (Sonnendach) · accidents FEDRO · surface runoff FOEN · surroundings © OpenStreetMap contributors · 3D model and aerial image © swisstopo.

The whole report

Up to 33 chapters. Interactive.

Not a PDF to leaf through, but a 3D model of your address in the browser: rotate it, choose the date and time, show and hide maps. Printable as PDF, available for 6 months.

  • 🔄 Rotate and zoom around the house, neighbours and trees
  • 🕒 Any date, any time for sun and shadow
  • 🗺️ Maps on the model to show and hide
All chapters in detail →
  1. View of the property
  2. At a glance
  3. Hours of sunshine at a glance
  4. The whole year at a glance
  5. Where the shadow comes from
  6. Sun path at the location
  7. Moon path at the location
  8. View from the façades
  9. Visible mountains
  10. Panoramic view with mountains
  11. Shadow on the reference dates
  12. Solar potential of the roofs
  13. Surroundings
  14. Surroundings in detail
  15. Time travel
  16. Natural hazards
  17. Noise
  18. Nuisances
  19. Air
  20. Internet and mobile network
  21. Public transport access
  22. Surface runoff
  23. Groundwater and soil
  24. Building zones
  25. Protection and inventories
  26. Road accidents
  27. Sunshine duration
  28. Shadow-hours map
  29. Plot and land-use planning
  30. Climate
  31. More details on the property
The report in 3D

Rather watch than read?

Using an example house, the 3D animation shows what the report can do: sun path, seating area, shadow, LiDAR trees, terrace, hills and location. With chapters you can click on.

  • Sun
  • Seating area
  • Shadow
  • LiDAR
  • Sun path
  • Terrace
  • Hills
  • Location
Opening frame of the 3D animation: example house with lake and mountains 3D animation · 8 chapters
Example

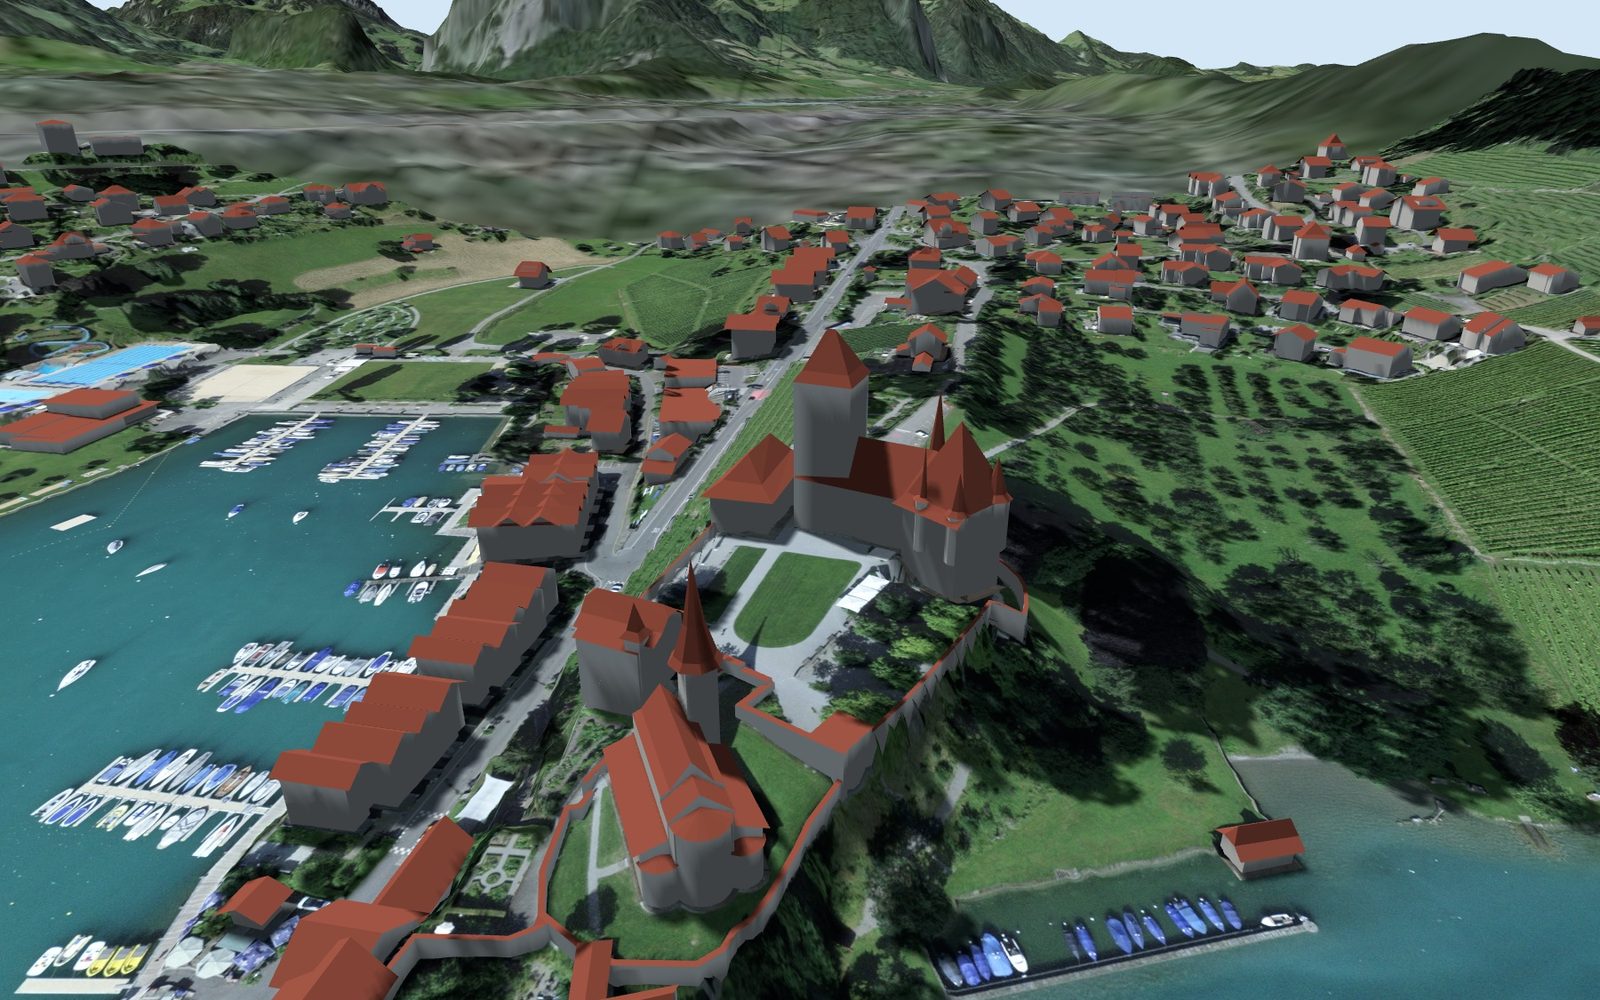
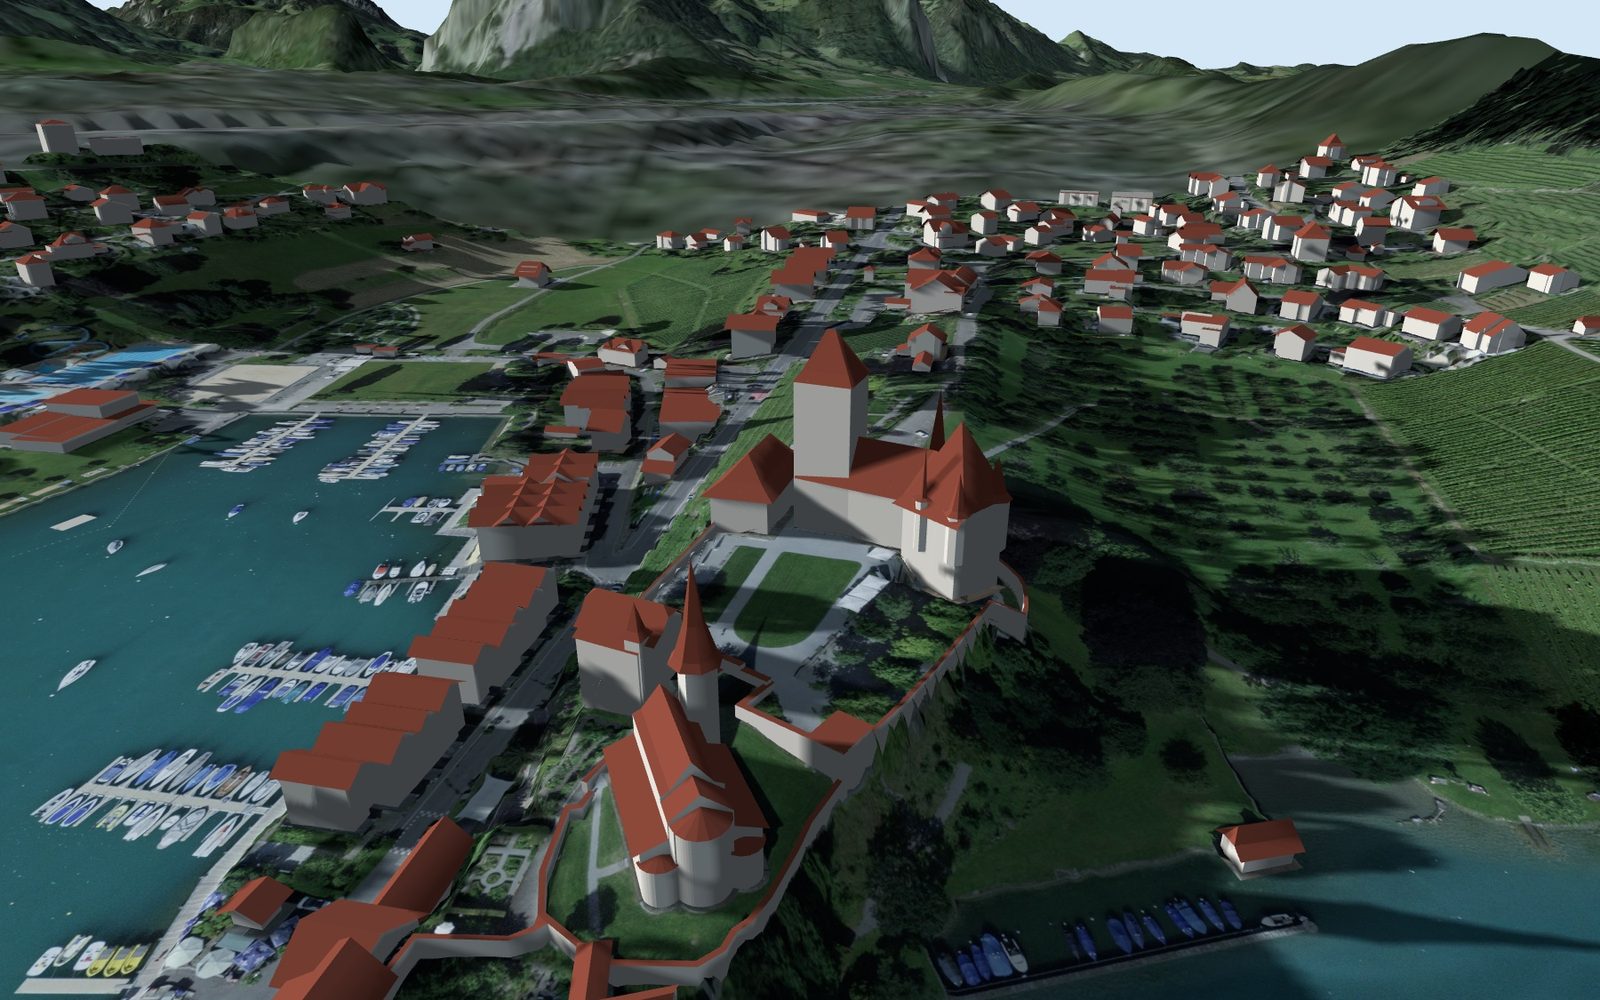
Spiez Castle, three reference dates.

The same place, the same camera. Only the sun moves. This is what the report for your address looks like.

Spiez Castle in the 3D model, shadow on 21 June at 08:00
21 June, 08:00
Spiez Castle in the 3D model, shadow on 21 June at 15:00
21 June, 15:00
Spiez Castle in the 3D model, shadow on 21 December at 13:00
21 December, 13:00
How it works

Address, payment, report.

  1. Enter an addressThe check shows which official data is available at the address. Then pay with TWINT, card, Apple Pay or Google Pay.
  2. The report is calculated3D model with terrain, buildings, trees and mountains, plus the maps, for exactly this address.
  3. Link by emailUsually within 24 hours. Interactive in the browser, printable as PDF, available for 6 months.
Price

One report, one address.

CHF 49one-off, incl. VAT
  • Up to 33 chapters, interactive and as PDF
  • Link by email, usually within 24 hours
  • Report a defect within 14 days: we fix it, otherwise you get your money back
  • Subscriptions for professionals: paused for now
Frequently asked questions

Short answers.

How quickly do I get the report?

Usually within 24 hours by email. The link is valid for 6 months; saved as a file, you can keep using it after that.

Are the images on this page of my address?

No, these are examples from Spiez and Lucerne. The report contains the real 3D model of your address from the swisstopo data.

How accurate are the values?

Calculated geometrically from official 3D data with terrain, buildings, trees and mountains, without clouds. Calculated values, not an expert appraisal.

What makes SunPlot different from free sun maps?

The report applies to one specific address and calculates with Switzerland’s official 3D data: terrain, buildings, mountains and trees from the laser point cloud. On top of that come the location chapters such as noise, public transport and natural hazards, all interactive and as PDF.

Can I return the report?

If something is wrong, for example a wrongly assigned building or a faulty map, get in touch within 14 days: we fix it and correct the affected maps or create the report again. You get your money back if a fix is not possible. The details are in section 8 of the Terms and Conditions.

All questions: Help · info@sunplot.ch

Your address, all year round.

Enter an address, look at the check, order the report. Link by email, usually within 24 hours.